A Comprehensive Guide to USDA Agricultural Data Analysis
Written on
Chapter 1: Introduction to USDA Data
In recent collaborations, I've delved into agricultural data trends across various states and timeframes. This exploration has led me to valuable sources of production data for specific commodities. Inspired by a generous gift of local honey from friends (which I'm enjoying quite frequently), I became curious about honey production trends. Perhaps I could inform my friend that production is on the rise, making it easier for them to replenish their stock.

Section 1.1: Accessing USDA Data via API
The USDA provides an accessible platform for acquiring agricultural statistics, particularly through their API. By utilizing R's 'rnassqs' package, we can effectively query the API and retrieve data based on our specific interests. To start, we need to load the necessary packages for our analysis:
# USDA DATA ANALYSIS
if(!requireNamespace("dplyr", quietly = TRUE)) install.packages("dplyr")
if(!requireNamespace("ggplot2", quietly = TRUE)) install.packages("ggplot2")
if(!requireNamespace("rnassqs", quietly = TRUE)) install.packages("rnassqs")
if(!requireNamespace("purrr", quietly = TRUE)) install.packages("purrr")
Once you have your API key, insert it into the code below, adjust it for your needs, and commence data collection!
nassqs_auth(key = "insertkeyhere")
# Focusing on WYOMING for honey production data over the last two decades
honey_data <- nassqs(commodity_desc = "HONEY", state_name = "WYOMING", year = 2004:2023)
After executing this, we will receive a dataset comprising various columns that detail production levels, regions, and other pertinent variables.
Section 1.2: Preparing the Data for Analysis
To ensure the year variable is appropriately formatted, we must convert it to numeric and aggregate the production data by year for visualization.
# Convert year to numeric for aggregation and plotting
honey_data$year <- as.numeric(as.character(honey_data$year))
# Aggregate honey production data by year
honey_production_yearly <- honey_data %>%
group_by(year) %>%
summarise(total_production = sum(Value, na.rm = TRUE))
honey_production_yearly
After verifying that the yearly data points are valid, we can proceed to visualize the findings.
Chapter 2: Visualizing Honey Production Trends
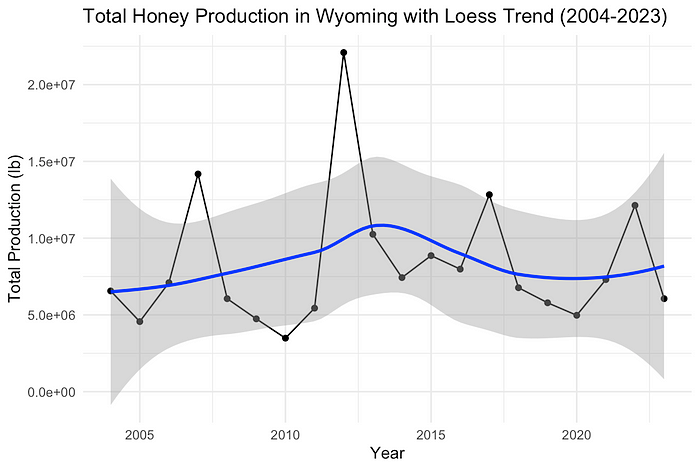
Using the ggplot2 library, we can create graphs to depict total honey production trends over time. Below is a series of visualizations that include a simple line graph, a linear model trend line, and a LOESS smoothed line to capture non-linear trends.
ggplot(honey_production_yearly, aes(x = year, y = total_production)) +
geom_line() +
geom_point() +
theme_minimal() +
labs(title = "Total Honey Production in Wyoming (2004-2023)",
x = "Year",
y = "Total Production (lb)")
ggplot(honey_production_yearly, aes(x = year, y = total_production)) +
geom_line() +
geom_point() +
geom_smooth(method = "lm", color = "red") + # Linear model
theme_minimal() +
labs(title = "Honey Production with Linear Trend (2004-2023)",
x = "Year",
y = "Total Production (lb)")
ggplot(honey_production_yearly, aes(x = year, y = total_production)) +
geom_line() +
geom_point() +
geom_smooth(method = "loess", color = "blue") + # Loess curve
theme_minimal() +
labs(title = "Honey Production with Loess Trend (2004-2023)",
x = "Year",
y = "Total Production (lb)")
The visualizations reveal significant fluctuations in honey production over the years. Notably, the growth witnessed around 2011 has since diminished, returning to levels comparable to two decades ago. While recent trends indicate a decline, this pattern seems to be cyclical, occurring roughly every decade.
Continuing to explore this dataset could lead to insights across additional states. Given that the data is available at the county level, it would be intriguing to examine the implications at a national scale concerning agricultural policy. If I uncover further interesting findings, I will update this piece accordingly.
Thank you for reading! Don’t forget to follow or subscribe!
Chapter 3: Understanding USDA NASS Quarterly Grain Stocks Reports
This video, titled "Understanding USDA NASS Quarterly Grain Stocks Reports: A Comprehensive Overview," provides an in-depth look at the USDA's quarterly grain stock reports, offering valuable insights into agricultural trends and practices.