Elevate Your Data Management Practices with Python Automation
Written on
Understanding Data Quality in Today's Enterprises
Anyone who works with data recognizes how crucial data quality is. Whether you're conducting straightforward analyses in Excel or using decision trees for sales forecasts, inadequate data can hinder your progress. While it’s tempting to blame the already burdened data stewards and demanding data consumers, the responsibility ultimately falls on data professionals, who serve as the bridge between both parties. So, how can you improve data management capabilities within your organization and promote more efficient analysis? One effective method is to automate your data quality assessments.
Defining Data Quality Metrics
Data quality can be understood in various ways, but I find the 4 V’s and 4 C’s particularly effective for discussions around data quality, as they are memorable and easy to visualize:
The 4 C’s: - Completeness — Is all expected data present? Are the essential columns filled? - Consistency — Are data values uniform across different datasets? - Conformity — Does the data adhere to specified formats? - Curiosity — Are stakeholders engaged and knowledgeable about the data management process?
The 4 V’s: - Volume — How much data exists? - Velocity — How often does new data arrive? How frequently is it processed? - Variety — What types of data are available? Is it structured, unstructured, or semi-structured? - Veracity — Is the data reliable? What discrepancies exist?
To effectively measure these concepts, I utilize several Python libraries. Pandas offers built-in methods for data investigation, such as .describe(), complemented by conditional formatting to identify patterns. For a more detailed analysis, I turn to pandas-profiling, which can be easily integrated into a Jupyter Notebook or exported as an HTML file.
import pandas as pd import pandas_profiling
df = pd.read_csv("raw_data.csv") df.describe()
profile = pandas_profiling.ProfileReport(df) profile.to_file("profile.html")
For data visualization, libraries like Matplotlib and Seaborn are excellent. Recently, I've been experimenting with Plotly for creating interactive and versatile visualizations that can be embedded into websites.
How to automate data processing in Python with Mito - YouTube
Promoting Data Discipline in Organizations
Having established a foundational understanding of data quality, it's time to automate! As data professionals, our role is to educate and inspire the organization to manage data effectively for analysis, which includes highlighting poor data quality and articulating the concept of data debt. Automation can reinforce best practices and foster a culture of transparency and accountability.
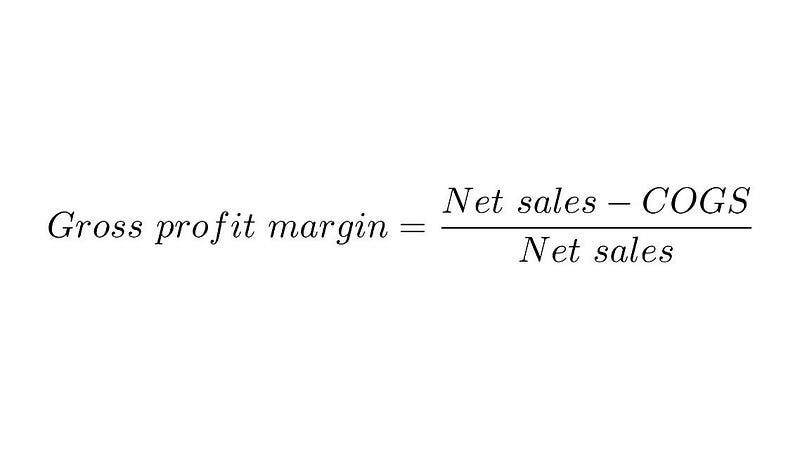
I recently participated in a project that focused on data ingestion to calculate profit margins for products worldwide, categorized by franchise. Initially prompted by an executive order to better grasp profitability, the project quickly grew complex. Like many global enterprises, my client aimed for strategic growth through acquisitions that would reduce operating costs, such as using distributors to streamline the supply chain.

Challenges in Data Management
Data completeness and conformity posed significant obstacles for margin calculations. Data would arrive from stewards in varying formats and structures, while the frequency of incoming data was inconsistent, leading to low veracity.
My role would eventually involve conducting advanced analyses on margin calculations to assess profitability and market share. However, without an effective data management strategy for calculating profit margins through the data science pipeline, I identified numerous opportunities for automation.
Strategic Collaboration for Solutions
We collaborated with data stewards, data owners, and a governance council to pinpoint only the necessary values for margin calculations, organized by function: product mappings, costs, unit conversions, and other attributes. Templates were designed for each global franchise so that data stewards only managed their respective assets, resulting in over 50 files being condensed into just 4.
I established a SharePoint site to host the templates in Document Repositories, akin to a directory folder. A simple Python script was then created to traverse the “folders,” merging files by function while adding columns like “Date Modified,” “Initial File Name,” and a “Completeness” metric that indicated the proportion of filled columns per row.
To alleviate the BI team’s burden of manually uploading flat files, I utilized pyODBC to connect to the enterprise SQL Server, loading only those records that met a satisfactory “Completeness” score.
import pyodbc
conn = pyodbc.connect('Driver={SQL Server};'
'Server=<server>;'
'Database=<database>;'
'Trusted_Connection=yes;')
cursor = conn.cursor() sql_query = "SELECT * FROM table_name" cursor.execute(sql_query) cursor.fetchall()
sql_df = pd.read_sql(sql_query, conn)
Once the data was uploaded to the data warehouse, I could check for conformity by cross-referencing it against information_schema and column constraints. An error log was maintained on the SharePoint site for data stewards to consult.
Finally, I calculated margins for the records loaded into SQL Server and visualized the results using Plotly, providing immediate feedback on franchise performance. This animated visualization showcased expected records, provided records, loaded records, records with margins, and the percentage of total revenue over time. Leaders could quickly assess which data stewards contributed quality data, identify any discrepancies, and track performance.

Conclusion: The Importance of Data Management
Data management may not be as glamorous as advanced analysis techniques, but it is equally crucial. Poor data can distract from insightful analysis and create challenges for talented data professionals if not managed properly. While simplified, the methodology presented here illustrates how people, processes, data, and technology can collaborate to create a vital metric for the organization. By focusing on the essentials of the data management lifecycle before delving into more complex analysis, teams can transition smoothly from data ingestion to data understanding.
Ultimately, my contributions will save the enterprise over 400 hours of manual work annually. Moreover, we have fostered a culture centered around data management and helped develop a cohesive data quality strategy. It’s time to start automating your data management practices!
Python Data Management: 1 - Data storage part1 - YouTube