Maximizing Insights from Retail Data: Your Comprehensive Guide
Written on
Chapter 1: Introduction to Retail Data Analysis
This blog serves as a guide for those interested in the Quantium Data Analytics Virtual Experience Program hosted on Forage, an online platform that offers free virtual internships. Following my previous article detailing various popular data analytics programs endorsed by industry leaders such as Accenture, KPMG, and Boston Consulting Group, I've received numerous inquiries about how to engage with these virtual internships.
This post aims to help newcomers navigate the world of virtual internships by providing a detailed walkthrough of the tasks and solutions from two programs I've previously completed. Today, we will focus on the Quantium Data Analytics Virtual Experience Program.
Section 1.1: Understanding the Retail Landscape
Retailers frequently alter their store layouts, product assortments, pricing, and promotional strategies to adapt to shifting customer preferences, remain competitive, and seize new opportunities. The Quantium analytics team plays a crucial role in assessing these changes, analyzing performance, and making recommendations based on the results.
Julia, a category manager for chips, has turned to Quantium for insights into the types of customers purchasing chips and their buying behaviors in the area.
As an analyst on the Quantium analytics team, your responsibility is to deliver valuable data analytics and insights that will assist the supermarket in making informed strategic decisions.
Section 1.2: Task 1 - Data Preparation and Customer Insights
For the initial task, you will be working with two datasets: transaction data and customer data. Your goal is to examine these datasets to uncover customer purchasing behaviors, generate insights, and provide commercial recommendations to Julia.
Specifically, you will need to:
- Analyze the data for inconsistencies, missing values, and outliers.
- Derive additional features such as pack size and brand names, and establish metrics to gain insights into spending behaviors across different customer segments.
- Create visual representations of the data to highlight interesting trends.
- Generate actionable insights and strategies, such as identifying which customer segments to target.
Solution Overview
To kick off your analysis, familiarize yourself with the two datasets: transactionData and customerData.

The transaction dataset comprises 264,836 entries and 8 columns, with each entry reflecting the purchase of a specific chip brand. Initially, one might assume that TXN_ID serves as the primary key, but this is misleading, as multiple chip brands can be included in a single transaction. Thus, the actual primary key should be a combination of TXN_ID and PROD_NBR.
To convert the numeric DATE field into a date format, use the following Python function:
# Convert date from numeric to date type
def xlseriesdate_to_datetime(xlserialdate):
excel_anchor = datetime.datetime(1900, 1, 1)
if(xlserialdate < 60):
delta_in_days = datetime.timedelta(days = (xlserialdate - 1))else:
delta_in_days = datetime.timedelta(days = (xlserialdate - 2))converted_date = excel_anchor + delta_in_days
return converted_date
Next, enhance your analysis by cleaning the PROD_NAME field and extracting pack sizes into a new column:
# Extract pack sizes
transactionData['PACK_SIZE'] = transactionData['PROD_NAME'].str.extract("(d+)")
transactionData['PACK_SIZE'] = pd.to_numeric(transactionData['PACK_SIZE'])
# Clean product name
def clean_text(text):
text = re.sub('[&/]', ' ', text)
text = re.sub('dw*', ' ', text)
return text
transactionData['PROD_NAME'] = transactionData['PROD_NAME'].apply(clean_text)
After performing distinct counts on the PROD_QTY field, you may find outliers, such as unusually high quantities for certain transactions. It’s essential to investigate these outliers further.

Section 1.3: Time Series Analysis
The transaction dataset spans from July 2018 to June 2019, offering a comprehensive year of data. Sales patterns generally remain stable throughout the year, with notable spikes in December. Notably, there are no sales recorded on Christmas Day, likely due to store closures.
Continuing with the PROD_NAME field, extracting brand names can be accomplished by isolating the first word in each entry. Further cleaning is necessary to ensure consistency in brand names across the dataset.
Moving forward, we will examine the customer dataset.

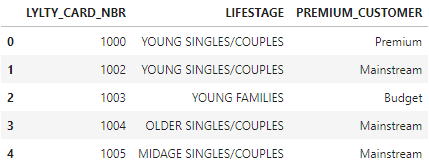
It’s critical to validate the primary key in any new dataset. In this case, the number of distinct LYLTY_CARD_NBR entries matches the total row count, confirming its validity.
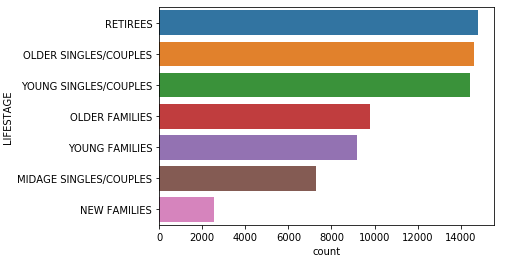
By plotting distributions for LIFESTAGE and PREMIUM_CUSTOMER, we can gain further insights into the customer base.

With no significant data issues in the customer dataset, you can safely merge this table with the transaction dataset based on the LYLTY_CARD_NBR field.
Now that the data is organized, you can begin deriving insights. Key questions to explore include:
- Which customer segments spend the most on chips, and what are their purchasing behaviors?
- How are customers distributed across different segments?
- What are the average chip prices by customer segment?
Insights and Visuals
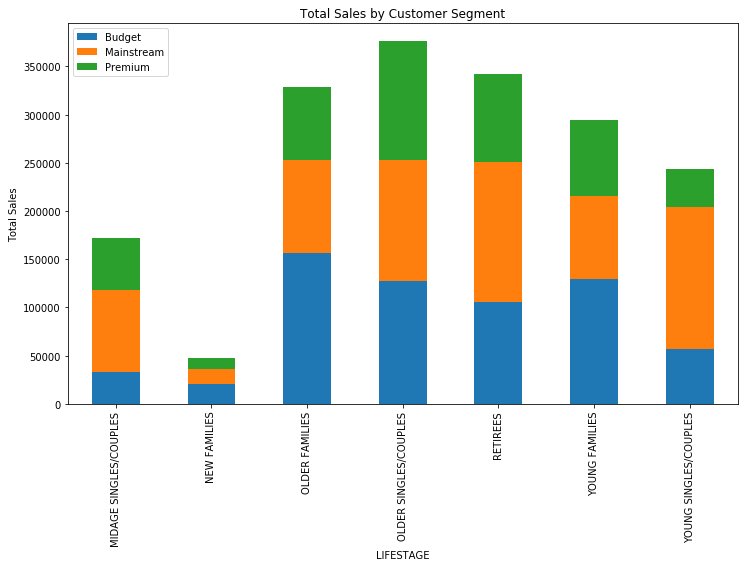
The following charts help answer these questions:

From the analysis, we find that budget older families, mainstream young singles/couples, and mainstream retirees generate the highest sales. The mainstream young singles/couples segment tends to spend more per packet of chips than their budget or premium counterparts.
Chapter 2: Experimentation and Uplift Testing
The first video titled "Want to get head start with Retail Data Analytics? This tutorial is all you need" provides a solid foundation for beginners looking to dive into retail data analytics.
Task 2 involves identifying benchmark stores to evaluate the effects of new store layouts on customer sales. You will need to:
- Select control stores based on total sales and customer metrics.
- Assess each trial store individually against its control counterpart.
- Compile findings and offer recommendations on the impact of the new layouts.
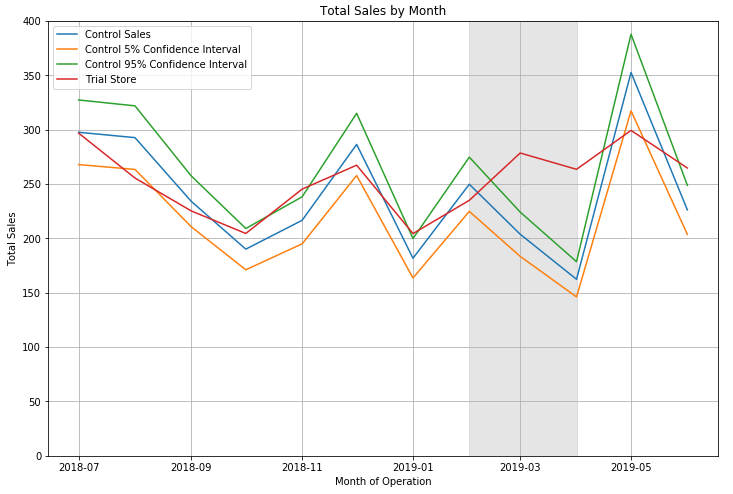
In this case, control stores 233, 155, and 237 were matched with trial stores 77, 86, and 88 based on sales and customer metrics.

This analysis allows us to determine the effectiveness of the new layouts during the trial period.
The second video titled "How Retailers Can Use Data to Improve Customer Experience" offers insights into leveraging data for enhanced customer engagement.
Chapter 3: Final Report and Recommendations
Task 3 requires synthesizing insights from earlier tasks into a comprehensive report for Julia, the category manager. The report should highlight key visualizations, insights, and actionable recommendations derived from the data.
This concludes the guide on the Quantium Data Analytics Virtual Experience Program. I hope this post equips you with the necessary tools to embark on your virtual internship journey and explore other data analytics programs available on Forage.
For additional resources and in-depth analyses, feel free to check out my GitHub repository or my YouTube channel, where I provide detailed walkthroughs of my coding processes.
Happy learning!